Tutorials References Menu

Python Tutorial

Python HOME Python Intro Python Get Started Python Syntax Python Comments Python Variables Python Data Types Python Numbers Python Casting Python Strings Python Booleans Python Operators Python Lists Python Tuples Python Sets Python Dictionaries Python If...Else Python While Loops Python For Loops Python Functions Python Lambda Python Arrays Python Classes/Objects Python Inheritance Python Iterators Python Scope Python Modules Python Dates Python Math Python JSON Python RegEx Python PIP Python Try...Except Python User Input Python String Formatting

File Handling

Python File Handling Python Read Files Python Write/Create Files Python Delete Files

Python Modules

NumPy Tutorial Pandas Tutorial SciPy Tutorial

Python Matplotlib

Matplotlib Intro Matplotlib Get Started Matplotlib Pyplot Matplotlib Plotting Matplotlib Markers Matplotlib Line Matplotlib Labels Matplotlib Grid Matplotlib Subplots Matplotlib Scatter Matplotlib Bars Matplotlib Histograms Matplotlib Pie Charts

Machine Learning

Getting Started Mean Median Mode Standard Deviation Percentile Data Distribution Normal Data Distribution Scatter Plot Linear Regression Polynomial Regression Multiple Regression Scale Train/Test Decision Tree

Python MySQL

MySQL Get Started MySQL Create Database MySQL Create Table MySQL Insert MySQL Select MySQL Where MySQL Order By MySQL Delete MySQL Drop Table MySQL Update MySQL Limit MySQL Join

Python MongoDB

MongoDB Get Started MongoDB Create Database MongoDB Create Collection MongoDB Insert MongoDB Find MongoDB Query MongoDB Sort MongoDB Delete MongoDB Drop Collection MongoDB Update MongoDB Limit

Python Reference

Python Overview Python Built-in Functions Python String Methods Python List Methods Python Dictionary Methods Python Tuple Methods Python Set Methods Python File Methods Python Keywords Python Exceptions Python Glossary

Module Reference

Random Module Requests Module Statistics Module Math Module cMath Module

Python How To

Remove List Duplicates Reverse a String Add Two Numbers

Python Examples

Python Examples Python Compiler

Machine Learning - Normal Data Distribution


Normal Data Distribution

In the previous chapter we learned how to create a completely random array, of a given size, and between two given values.

In this chapter we will learn how to create an array where the values are concentrated around a given value.

In probability theory this kind of data distribution is known as the normal data distribution, or the Gaussian data distribution, after the mathematician Carl Friedrich Gauss who came up with the formula of this data distribution.

Example

A typical normal data distribution:

import numpy
import matplotlib.pyplot as plt

x = numpy.random.normal(5.0, 1.0, 100000)

plt.hist(x, 100)
plt.show()

Result:

Run example »

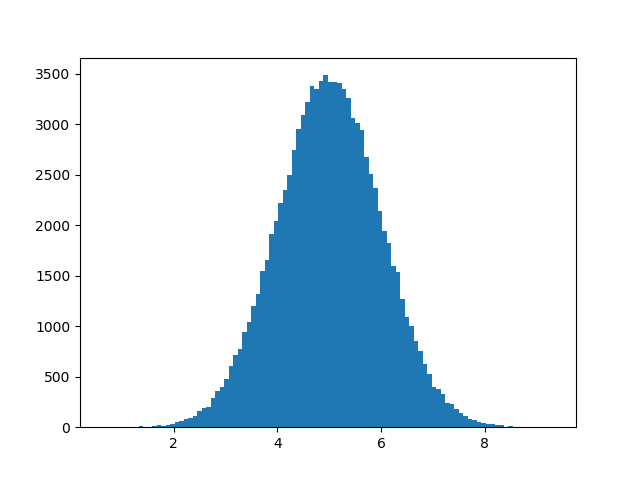
Note: A normal distribution graph is also known as the bell curve because of it's characteristic shape of a bell.

Histogram Explained

We use the array from the numpy.random.normal() method, with 100000 values,  to draw a histogram with 100 bars.

We specify that the mean value is 5.0, and the standard deviation is 1.0.

Meaning that the values should be concentrated around 5.0, and rarely further away than 1.0 from the mean.

And as you can see from the histogram, most values are between 4.0 and 6.0, with a top at approximately 5.0.